Cost Profiler - Analyze GitHub Actions Costs
Analyze GitHub Actions costs with Pipetrics Cost Profiler. Find expensive workflows and optimize your CI/CD budget with flamegraph visualization.
Cost Profiler for GitHub Actions Costs
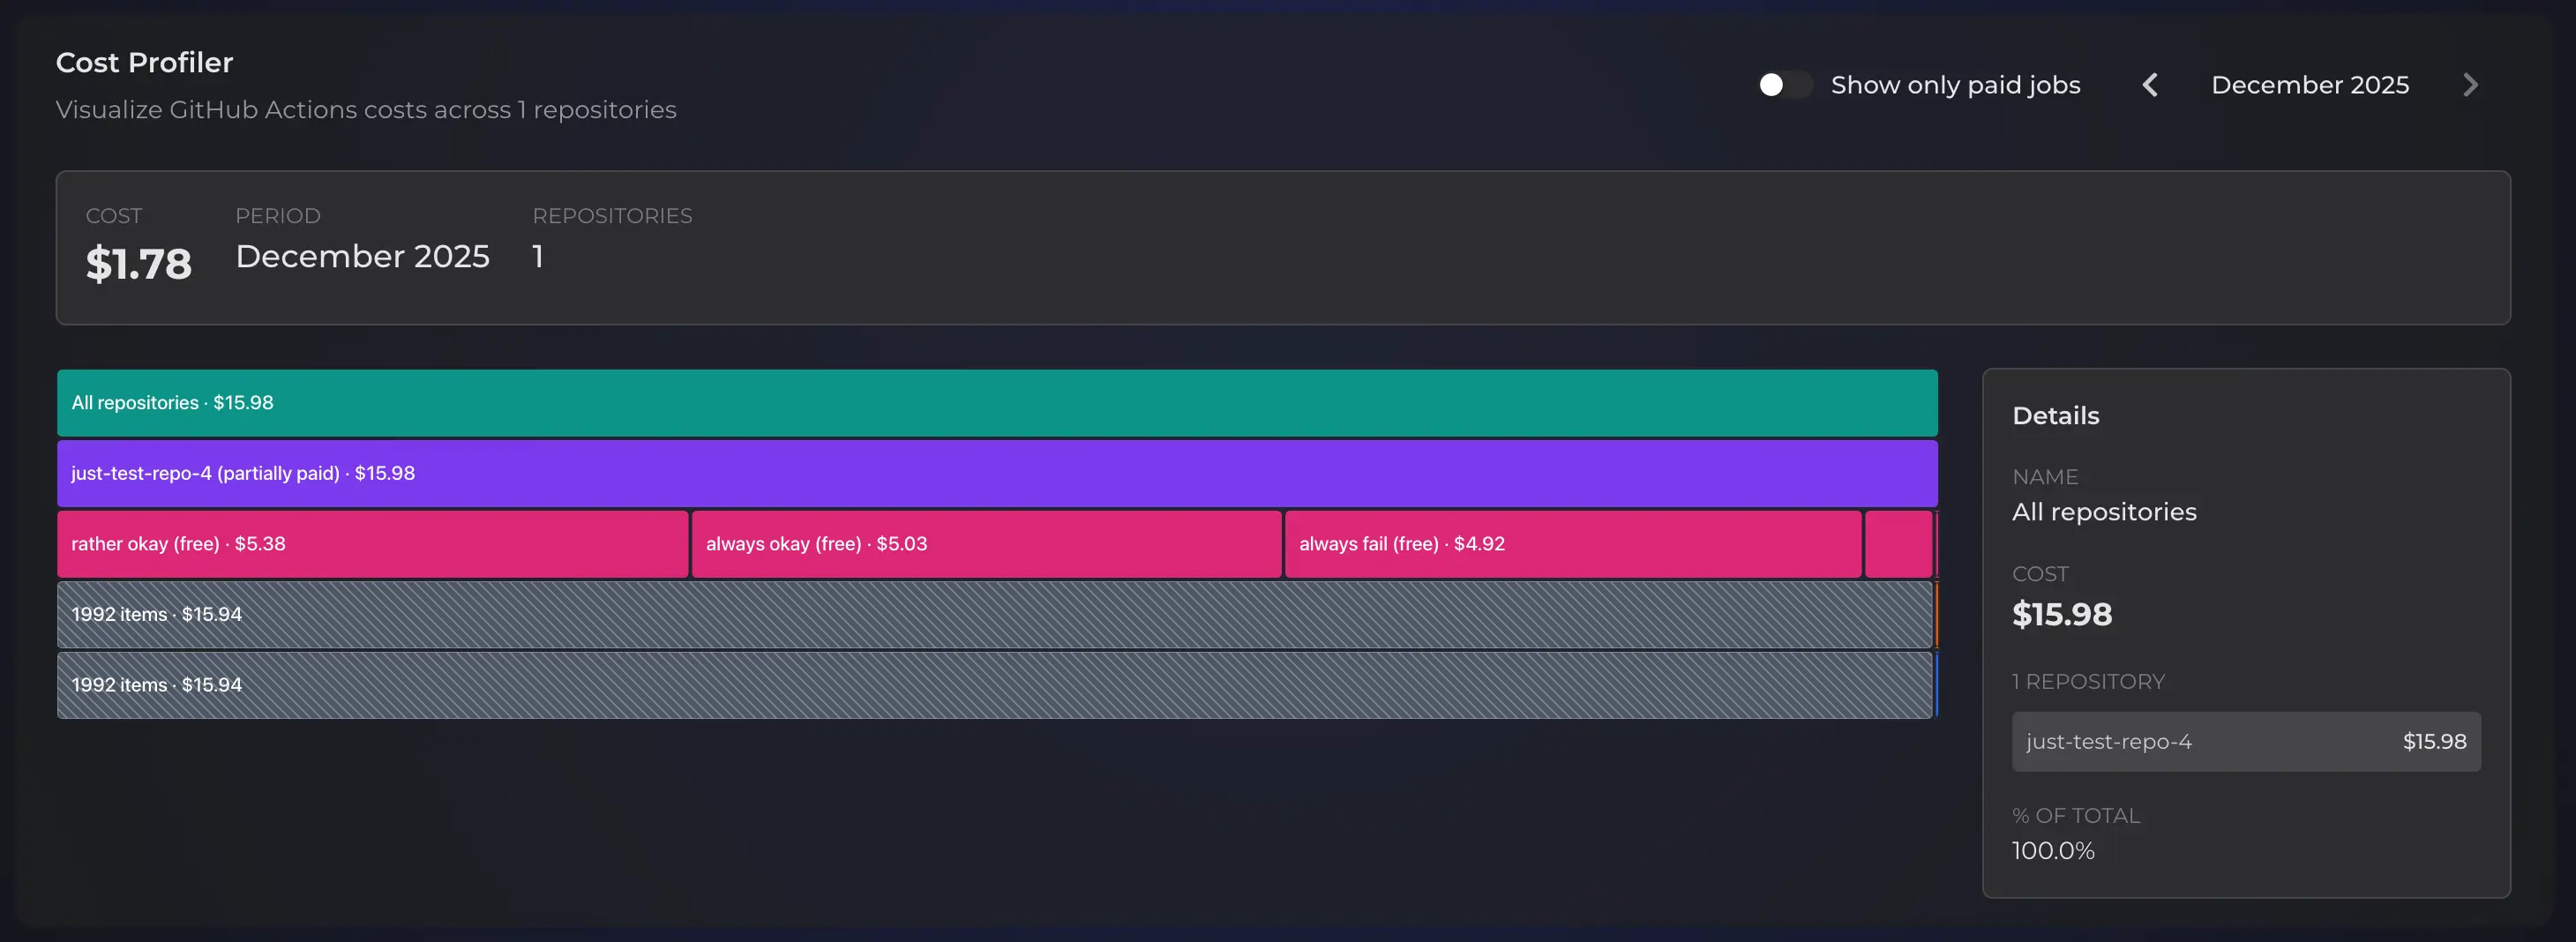
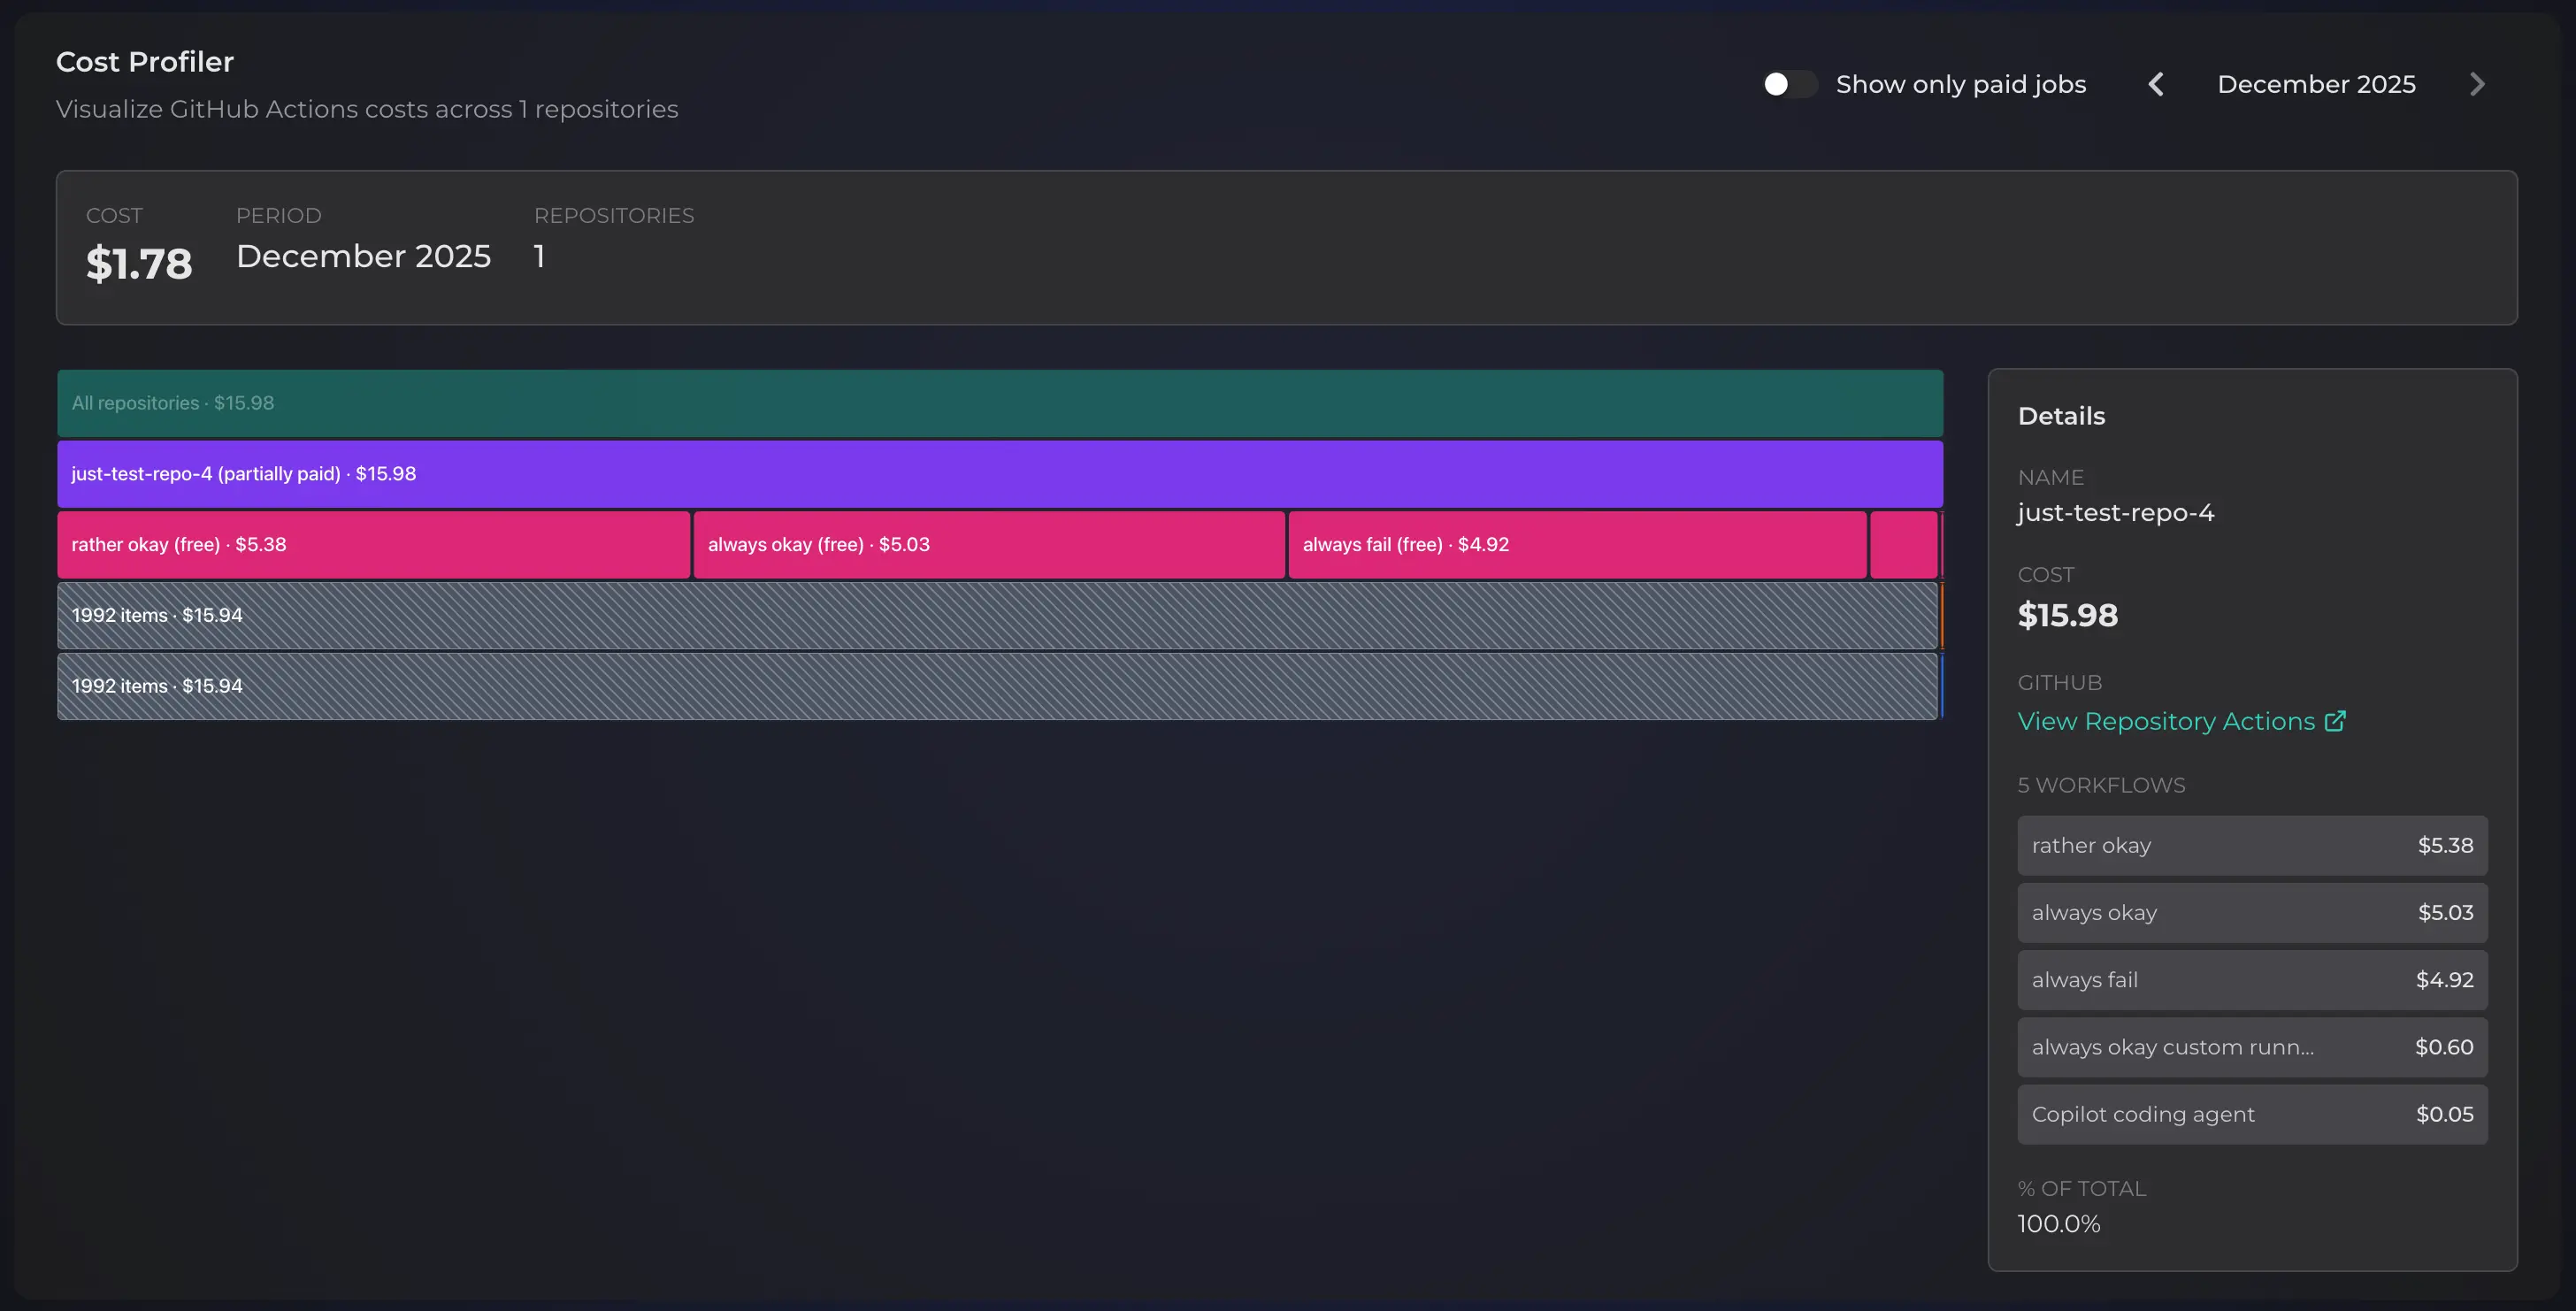
Get visibility into your GitHub Actions costs with Pipetrics Cost Profiler. Specifically, this tool shows where your CI/CD budget goes. It uses an interactive flamegraph chart where each block represents a portion of your total spending.
Why Use Cost Profiler for GitHub Actions Costs?
First, GitHub Actions billing can be confusing. Teams often discover unexpected costs at month end. Also, tracing expenses back to specific workflows is difficult. However, with Cost Profiler, you get complete visibility. Consequently, your team makes better optimization decisions. Moreover, you prevent budget surprises before they happen.
Furthermore, the flamegraph visualization makes analysis intuitive. Instead of digging through logs, you see GitHub Actions costs at a glance. Therefore, identifying expensive workflows takes seconds, not hours. Additionally, the drill-down feature reveals exactly where money goes.
How Cost Profiler Works
The flamegraph shows your GitHub Actions costs hierarchically. Specifically, you can explore spending at multiple levels:
- Organization level - Shows all repositories costs together
- Repository level - Lets you drill down into one specific repo
- Workflow level - Reveals which workflow files cost the most
Navigation Features
Cost Profiler offers intuitive navigation options. Here is how to use them:
- Click any block to drill down into that level for more detail
- Use breadcrumbs to navigate back up the hierarchy easily
- Month selector lets you switch between months to track spending
- Paid only toggle filters out free tier usage to show billable jobs

What You Can Do With Cost Profiler
Cost Profiler helps teams optimize GitHub Actions costs. Below are the main benefits.
Find Expensive Workflows Instantly
First, quickly identify which repositories cost the most. The flamegraph makes spotting cost hotspots easy. Consequently, you know where to focus optimization efforts immediately.
Identify Wasteful GitHub Actions Spending
Similarly, discover redundant or failed jobs in your workflows. Then, drill down to find waste. As a result, you can eliminate unnecessary costs and reduce spending significantly.
Track GitHub Actions Cost Trends
Likewise, compare spending across months easily. Use the month selector to analyze historical data. Therefore, you can identify patterns and prevent budget overruns early.
Optimize Your CI/CD Spending
Finally, get complete visibility into your GitHub Actions costs. Consequently, you make data-driven optimization decisions. In other words, you know exactly where changes will have maximum impact.
Cost Profiler Pricing
Below is a feature comparison between Free and Pro plans.
| Feature | Free Plan | Pro Plan |
|---|---|---|
| Cost Profiler access | Current month only | Full history (360 days) |
| Historical data | Not included | Included |
The Free plan helps you understand immediate spending. However, upgrading to Pro unlocks full historical access. As a result, you gain trend analysis and month-over-month comparisons.
Getting Started With Cost Profiler
Setting up Cost Profiler takes just a few minutes. Follow these steps below.
Prerequisites
First, complete the GitHub App integration. This connection allows Pipetrics to access your workflow run data.
Step 1: Navigate to Cost Profiler
Initially, go to your organization dashboard in Pipetrics. Then, click on Cost Profiler in the sidebar navigation.
Step 2: Select a Time Period
Next, choose a month from the dropdown selector. Free users see the current month only. However, Pro users can select any month within the last 360 days.
Step 3: Explore Your GitHub Actions Costs
Finally, click any block in the flamegraph to drill down. Start at the organization level for the big picture. Then, explore repositories and workflows.
Tips for Using Cost Profiler Effectively
Here are practical tips for analyzing GitHub Actions costs:
- Start broad - Begin at the organization level to see the big picture first
- Use filters - Enable the paid-only filter to focus on billable costs only
- Compare months - Review multiple months to identify cost trends and anomalies
- Go deep - Drill down to find specific optimization opportunities
- Check regularly - Review costs weekly to catch issues before they grow
Integration Requirements
Before using Cost Profiler, ensure you have completed the GitHub App integration. The Cost Profiler requires workflow run data from your repositories. Additionally, check the FAQ for common questions about data access and permissions.
Next Steps
Ready to analyze your GitHub Actions costs? Visit the Pipetrics app to access Cost Profiler. Also, explore our Slack integration to receive workflow notifications directly in your team channels.
Integration
Step-by-step guide to install the Pipetrics GitHub App and connect your repositories for GitHub Actions monitoring.
Slack Integration for GitHub Actions - Real-Time Workflow Notifications
Set up Slack integration for GitHub Actions with Pipetrics. Get instant workflow notifications and smart filtering for teams.