

Pipetrics August 2026 Product Update: MCP & CI Insights
Pipetrics August 2026 product update adds MCP, repository insights, commit impact analysis, job details, Cost Profiler filters, and rerun tracking.
The Pipetrics August 2026 product update turns measured GitHub Actions data into practical answers for CTOs, engineering managers, and platform teams. The headline addition is Pipetrics MCP: an AI-ready interface for investigating CI time, failures, and spending from your coding agent.
We also added repository insights, commit impact analysis, a redesigned workflow jobs view, new Cost Profiler filters, complete rerun support, and a visual refresh across the application.
Pipetrics MCP: an AI advisor for GitHub Actions
Generic CI advice cannot tell you which workflow is wasting your team's time or which failed job is consuming your budget. Useful recommendations need evidence from your own pipelines.
One endpoint. Your GitHub Actions evidence.
Pipetrics MCP endpoint: https://mcp.pipetrics.com/mcp
Connect it once, then investigate CI performance and spending from your preferred coding agent.
Pipetrics MCP makes measured GitHub Actions telemetry available to Codex, Claude Code, OpenCode, and other clients that support the Model Context Protocol. Your agent can analyze:
- Workflow runtime and queue delays
- Estimated GitHub Actions costs
- Failed runtime and failed spend
- Job and step bottlenecks
- Retries and rerun attempts
- Commit-associated performance changes
You can ask questions such as:
- Which workflows consumed the most CI time this month?
- Where are we spending money on failed runs?
- Which job is slowing down deployments?
- Which commits were associated with recent runtime regressions?
- What are the three CI issues that need attention first?
Pipetrics supplies the measurements without receiving your source code. Your coding agent can inspect workflow files in your local workspace separately, subject to its own permissions. This connects measured production behavior with the configuration that caused it.
Connect Pipetrics MCP and try the example prompts.
Repository insights in the Pipetrics August 2026 product update
The new repository insights section highlights the most important findings for the selected period. It gives engineering leaders a quick answer to “what needs attention?” before they open individual workflow reports.
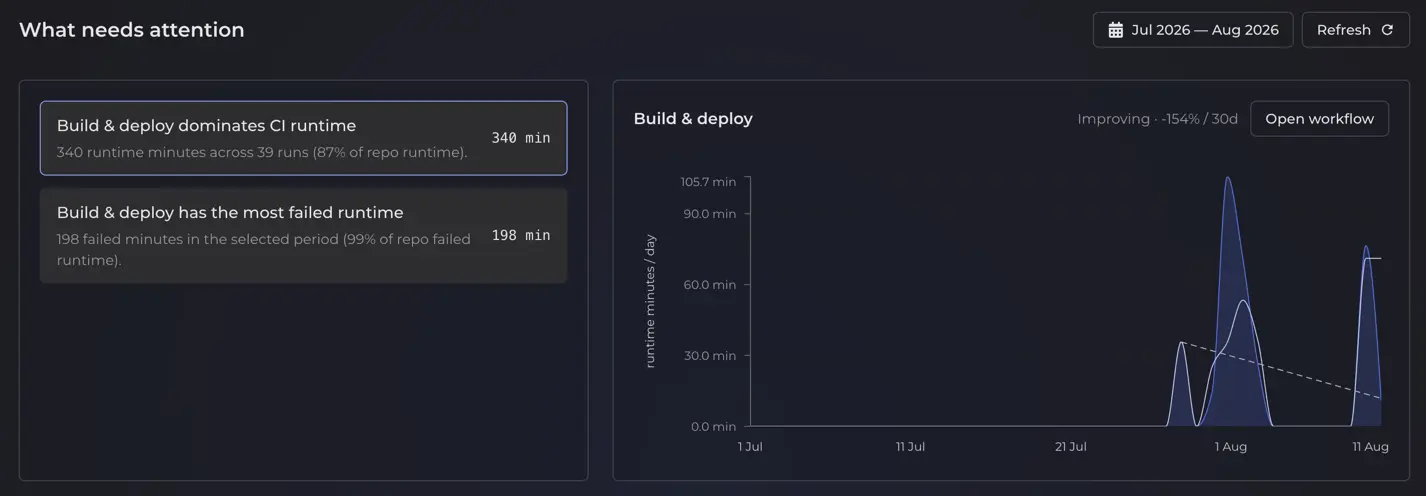
Repository insights identify:
- The workflow that dominates repository runtime
- The workflow with the most failed runtime
- Whether workflow performance is improving or regressing
- How much each workflow contributes to overall CI usage
Each finding links to the relevant workflow, so you can move from a repository-level signal to a focused investigation.
Commit impact connects CI changes to commits
When CI time suddenly increases, teams need to know when the change appeared and which commit was associated with it.
The new Commit impact view compares adjacent observed commits for an individual workflow file.
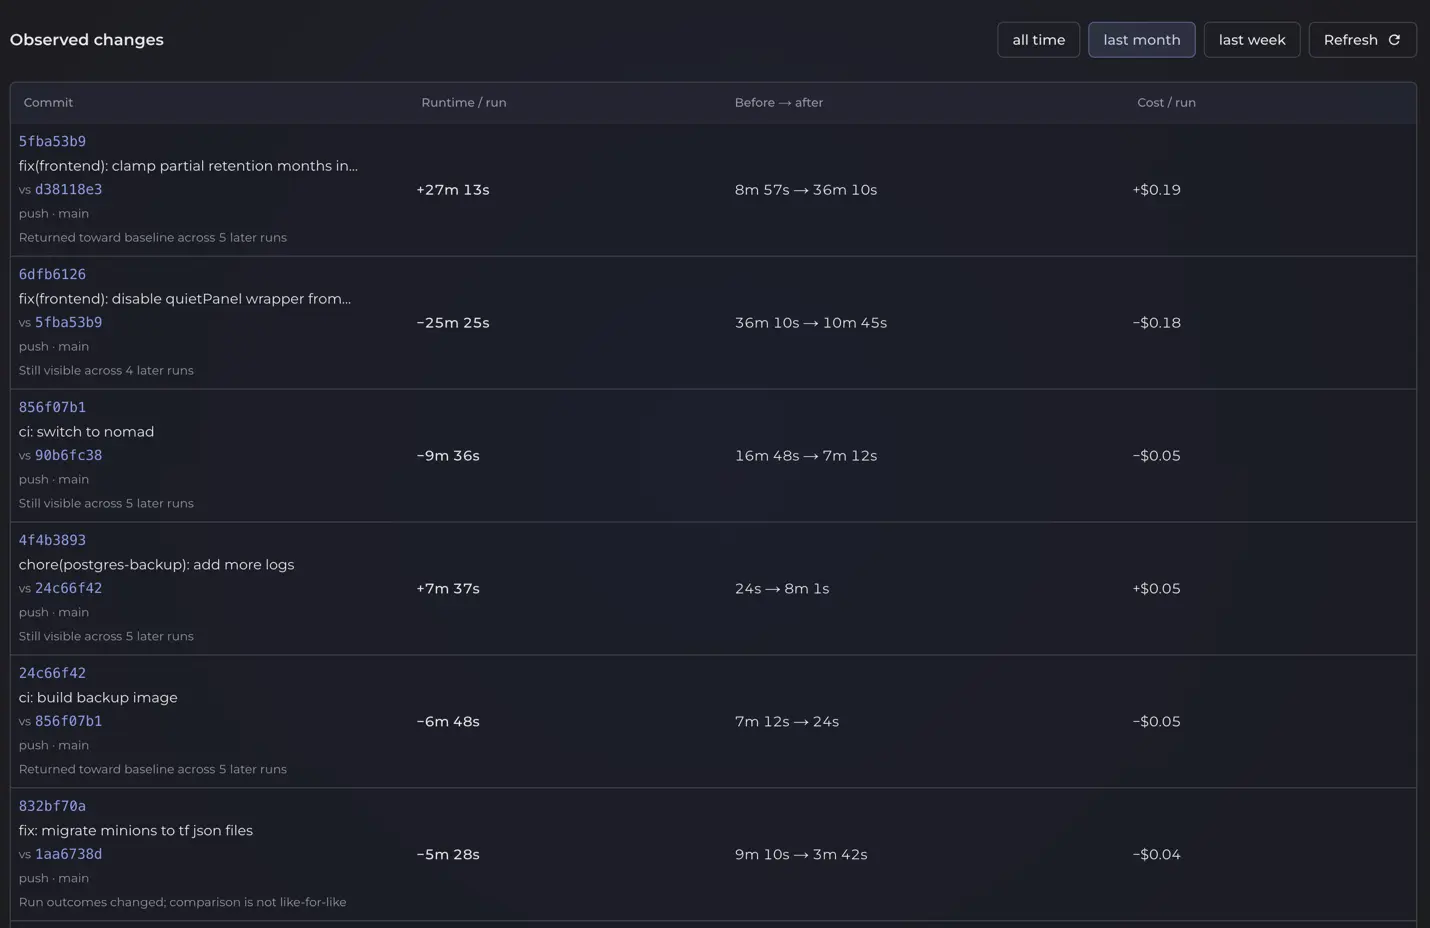
For each observed change, Pipetrics shows:
- The before and after commits
- Runtime per run
- The size of the increase or decrease
- Estimated cost impact per run
- Whether the change remained visible in later executions
Commit impact provides evidence for an investigation; it does not claim that a commit caused the regression. Your team or coding agent can inspect the corresponding diff before recommending a change.
Redesigned GitHub Actions job analysis
We redesigned the workflow jobs view to make job-level bottlenecks easier to understand.
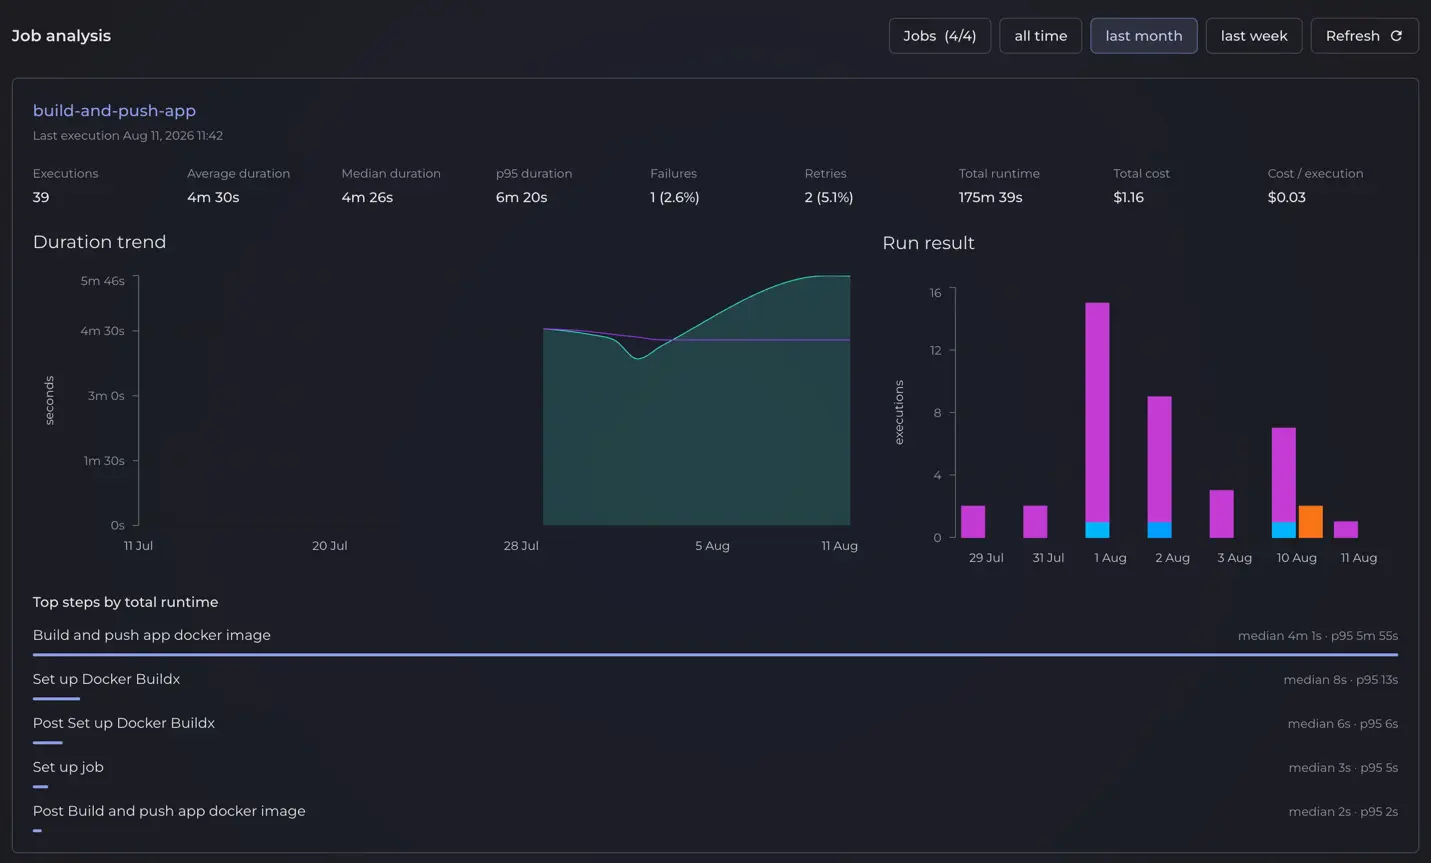
The new view brings together:
- Execution count
- Average, median, and p95 duration
- Failures and retries
- Total runtime and estimated cost
- Cost per execution
- Duration trends and run outcomes
- Steps ranked by total runtime
This makes it easier to distinguish a consistently slow job from an occasional outlier and identify the exact step worth optimizing.
Filter GitHub Actions spending in Cost Profiler
Cost Profiler now lets you narrow spending data without losing the visual overview. Search by name or combine filters to investigate a specific part of your GitHub Actions usage.
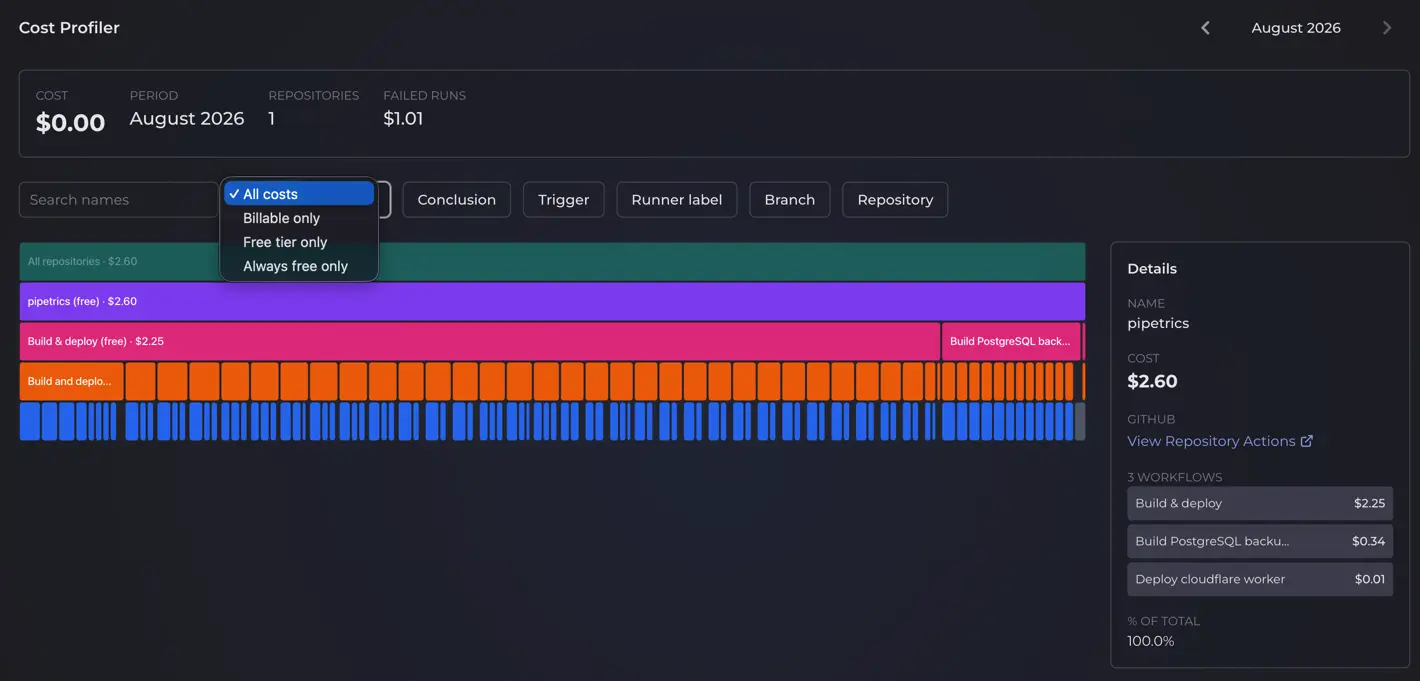
You can filter costs by:
- Billing category: all costs, billable only, free tier only, or always free only
- Job conclusion
- Workflow trigger
- Runner label
- Branch
- Repository
The flamegraph and details panel update together, making it easier to isolate failed runs, compare branches, inspect runner usage, or focus on one repository.
Learn more about visual GitHub Actions spending analysis.
August product update: accurate GitHub Actions rerun tracking
Pipetrics now includes every valid rerun attempt in runtime, failure, and cost analysis. Earlier calculations did not consistently account for rerun jobs, which meant some of the real work performed by GitHub Actions was missing from reports.
While adding rerun support, we also found that skipped jobs recreated during a rerun can contain completion timestamps earlier than their start timestamps. Those invalid values could produce negative runtime in repository summaries.
We introduced one shared runtime eligibility rule across summaries, usage reports, workflow analysis, cost calculations, and billing. Valid rerun attempts are now counted, while skipped jobs with reversed timestamps cannot distort time or spending data.
Read the engineering investigation: why GitHub Actions reruns produced negative durations.
A clearer and more consistent Pipetrics
The August release also includes a broader visual refresh. We improved navigation, information hierarchy, charts, tables, filters, and consistency across repository and workflow views.
We fixed many smaller issues along the way, including edge cases in zero-cost calculations and job-level aggregation. Together, these changes make Pipetrics faster to scan and more reliable when a team needs an answer.
Start optimizing GitHub Actions with evidence
Pipetrics now supports a complete investigation flow: find the repository issue that matters, inspect the responsible workflow and jobs, identify associated commits, and ask your coding agent to plan a focused improvement.
Connect Pipetrics MCP or install the Pipetrics GitHub App to get started.
FAQ
Answers to common questions about Pipetrics GitHub Actions observability, Grafana integration, and data retention.
GitHub Actions Negative Durations After Reruns
GitHub Actions negative durations can appear when rerun jobs contain reversed timestamps. Learn why they happen and how Pipetrics keeps CI metrics accurate.